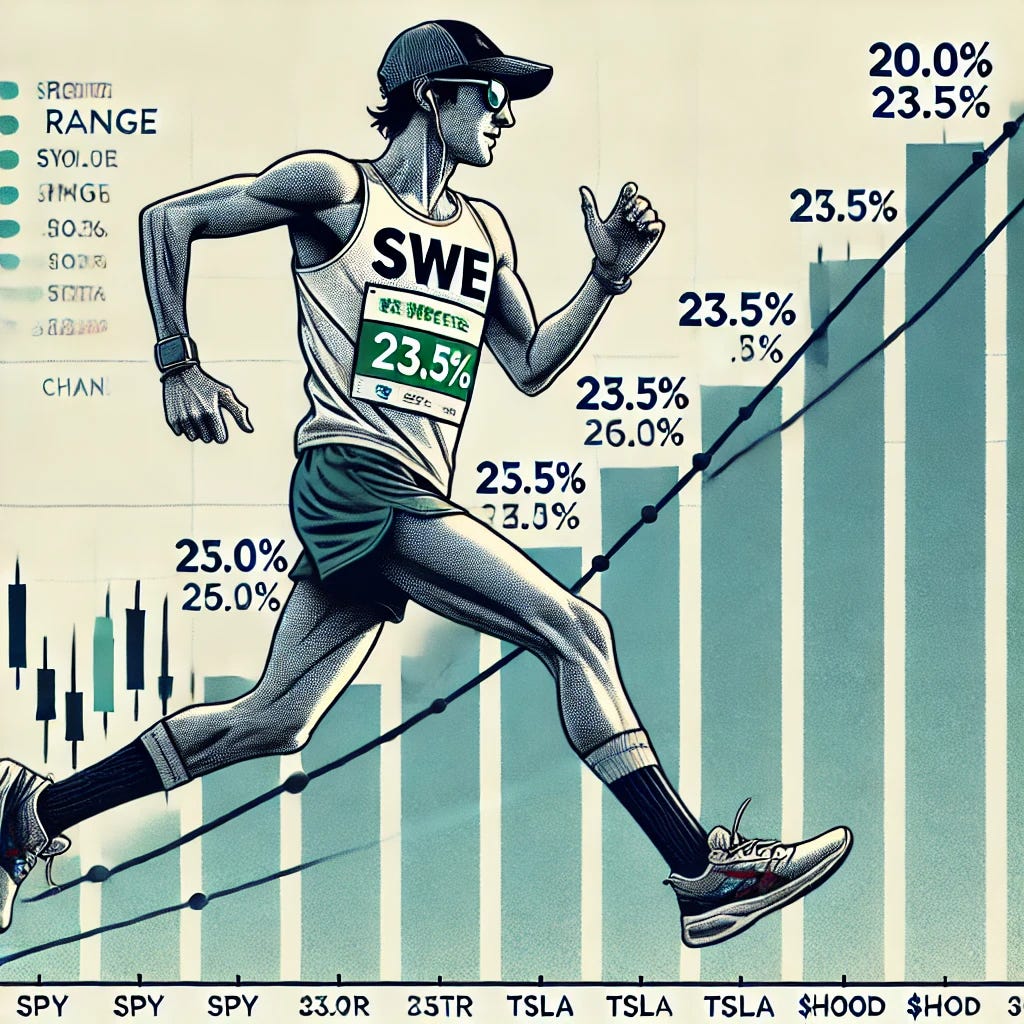
SPY Range Finder... 11.1%
The $SPY has "more to do" since the annual range (high/low) is 20-30%
If the market cap weighted SPY 0.00%↑ is act in the same manner it has for the past 10+ years, it will see a lot more action in the nine months of 2025. Why? The range (dividing the high of the year by the low of the year) has produced RNG% of 20-30% each year and YTD’25 is only 11.1%.
Here’s the past 10 years
30.2% (2024) +24%
26.5% (2023) +26%
-27.4% (2022) -19%
30.9% (2021) +29%
72.6% (2020) +18%
28.0% (2019) +31%
25.2% (2018) -5%
19.9% (2017) +21%
20.1% (2016) +12%
26.2% (2015) +1%
22.8% (2014) +13%
Even the outlier from lockdown 2020 (reminder of my book #WTM: What The Money) had a range almost 7 times the YTD’25 range of 11.1% in the S-P-Y. Very few are planning on a range over 70%, but that’s besides the point that 20-30% is very common. The average of these 11 years is 29.9%, and is still 25.7% when excluding the outlier. Since I enjoy the prime numbers, here are two ways the range for 2025 when it is said and done could be 23.5%.
Bull Case - the low is in…
LOW: $551.10 + 23.5% = $680.61
Implied “change” (Current $563.98): +20.6%
Implied “CHG%” (YE’24 $586.08): +16.1%
Bear Case - the high is in…
HIGH: $612.90 - 23.5% = $496.28
Implied CHG% (from Current): -12.0%
Implied CHG% (from YE’24): -15.3%
I’ve been studying RNG vs CHG for a while now in building the ultimate algorithm for turning stock charts into workouts. Suffice to say, there is more cardio Fitness Zone 5 cardio activity the higher the range. If you’ve ever listened to prognosticators about the overall market, it may sound of little help when people say they think the S&P will rise “more than” or “less than” the average. What’s average?
10%+ is becoming the norm for S&P 500 annual gains… 5-7% was replaced by 7-10% CHANGE per year…. and RANGE is trending from 20-25% to 25-30%.
I will continue to tell offshoots of this storyline throughout the year. I’m in the bull camp for year-end. Below I’ll compare it to some of the well known recently updated forecasts.
Keep reading with a 7-day free trial
Subscribe to WATT STREET to keep reading this post and get 7 days of free access to the full post archives.


